.webp?dpl=dpl_5xtBof1hGo35mqXA327c5e7WiW8n)
Compare candidates side by side — scored on the same criteria.
You ran structured interviews. Now put every candidate for the role in one grid — scored on the same competencies, skills, and outcomes — and decide on the evidence instead of the loudest opinion in the debrief.
Built from the interviews you already ran.
Comparing candidates is a view in Yardstick: several candidates for the same role next to each other, scored against the same criteria, so you can see who's strongest where instead of comparing half-remembered conversations. If you've been searching for a candidate comparison tool — or candidate comparison software — this is that, already connected to your interviews.
Many teams do this in a spreadsheet, or not at all — they advance whoever the last interviewer felt good about. Yardstick builds the comparison for you out of work your team already did: the scores interviewers recorded on each candidate's scorecard. Nothing to re-enter, nothing to average by hand.
Yardstick is the structured-interview ATS built for humans and agents — the comparison grid is the part where the structure pays off.
Every candidate, scored on the same criteria.
Pick a role and Yardstick lays out every candidate for it in a single grid. The columns are that role's own criteria — grouped into Summary, Competencies, Skills, and Role Outcomes — so you're never comparing a designer against a generic five-star rating. You're comparing them against the bar you set for this job.
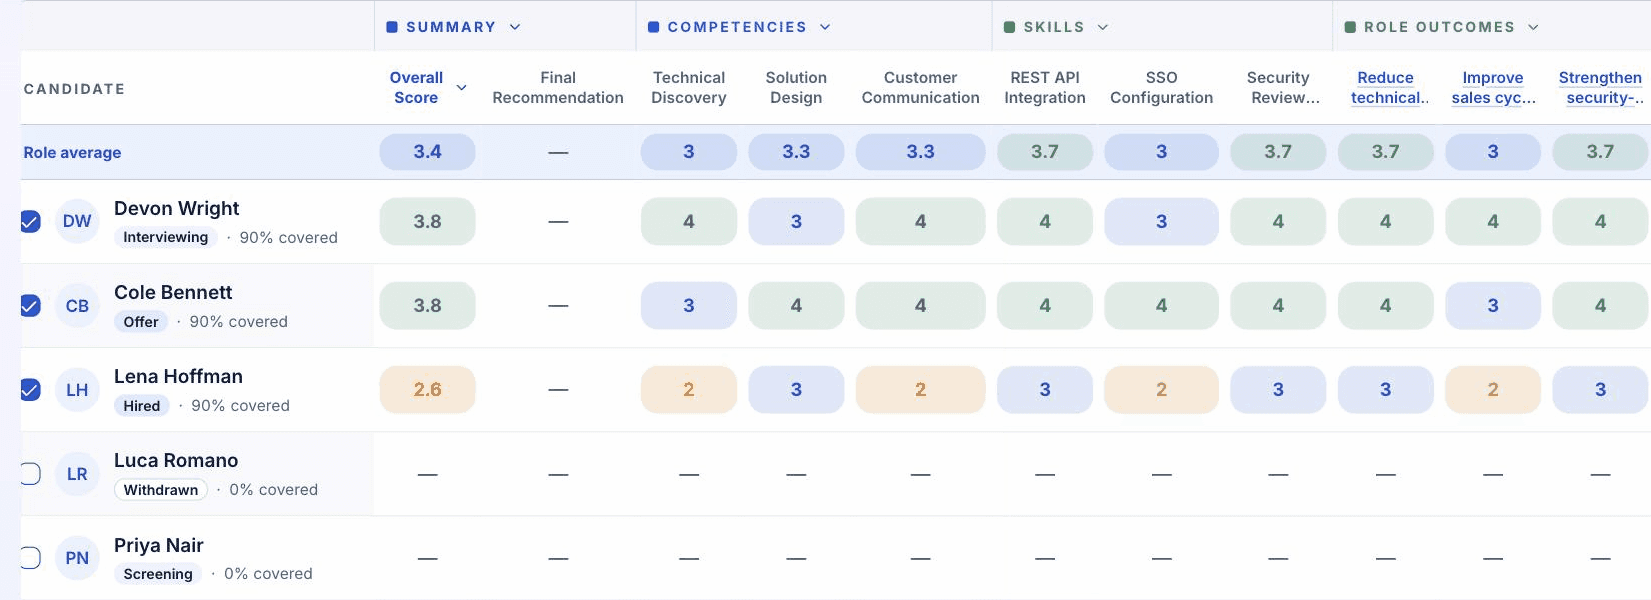
Scores come straight from your interview scorecards
Every number in the grid is a 0–4.0 rating an interviewer gave on a scorecard — not an algorithm's guess about a résumé. The grid gathers those human judgments in one place and lines them up. Each candidate also shows how much of the scorecard is complete, so you can tell a confident 3.5 from one based on a single round.
A role-average baseline on every score
Every score sits against the role average, so a “3” reads as what it is — above the bar, at it, or below — without you holding the whole pipeline in your head.
By candidate or by dimension.
Flip the grid to match the question you're asking. By candidate puts people in rows — good for “how does this person look overall?” By dimension transposes it — every candidate in a column against one competency — for “who is strongest on system design?”
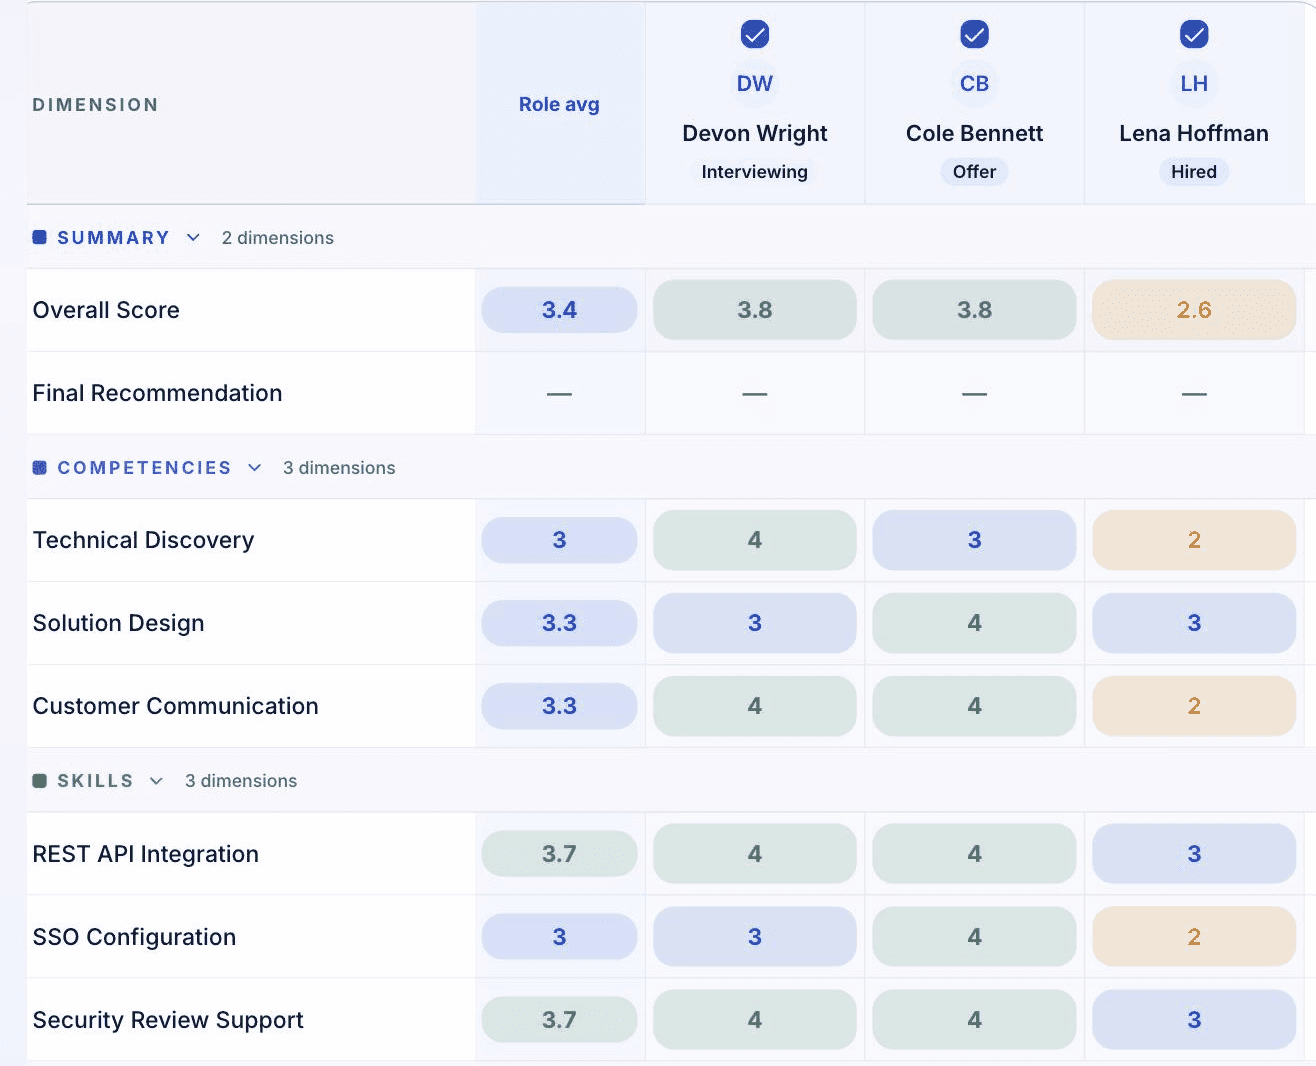
Heatmap
Read the whole grid by color in one glance.
Bars
See each score against the rest of the band.
Numbers
Get the exact 0–4.0 figure when it matters.
Dots
Skim a compact, low-ink view of every score.
Filter to the shortlist — Strong, Solid, Mixed, Below
Filter the grid to a score band — Strong, Solid, Mixed, Below, or not-yet-scored — or search by name, and a long pipeline collapses to the few people worth a closer look.
Compare candidates side by side.
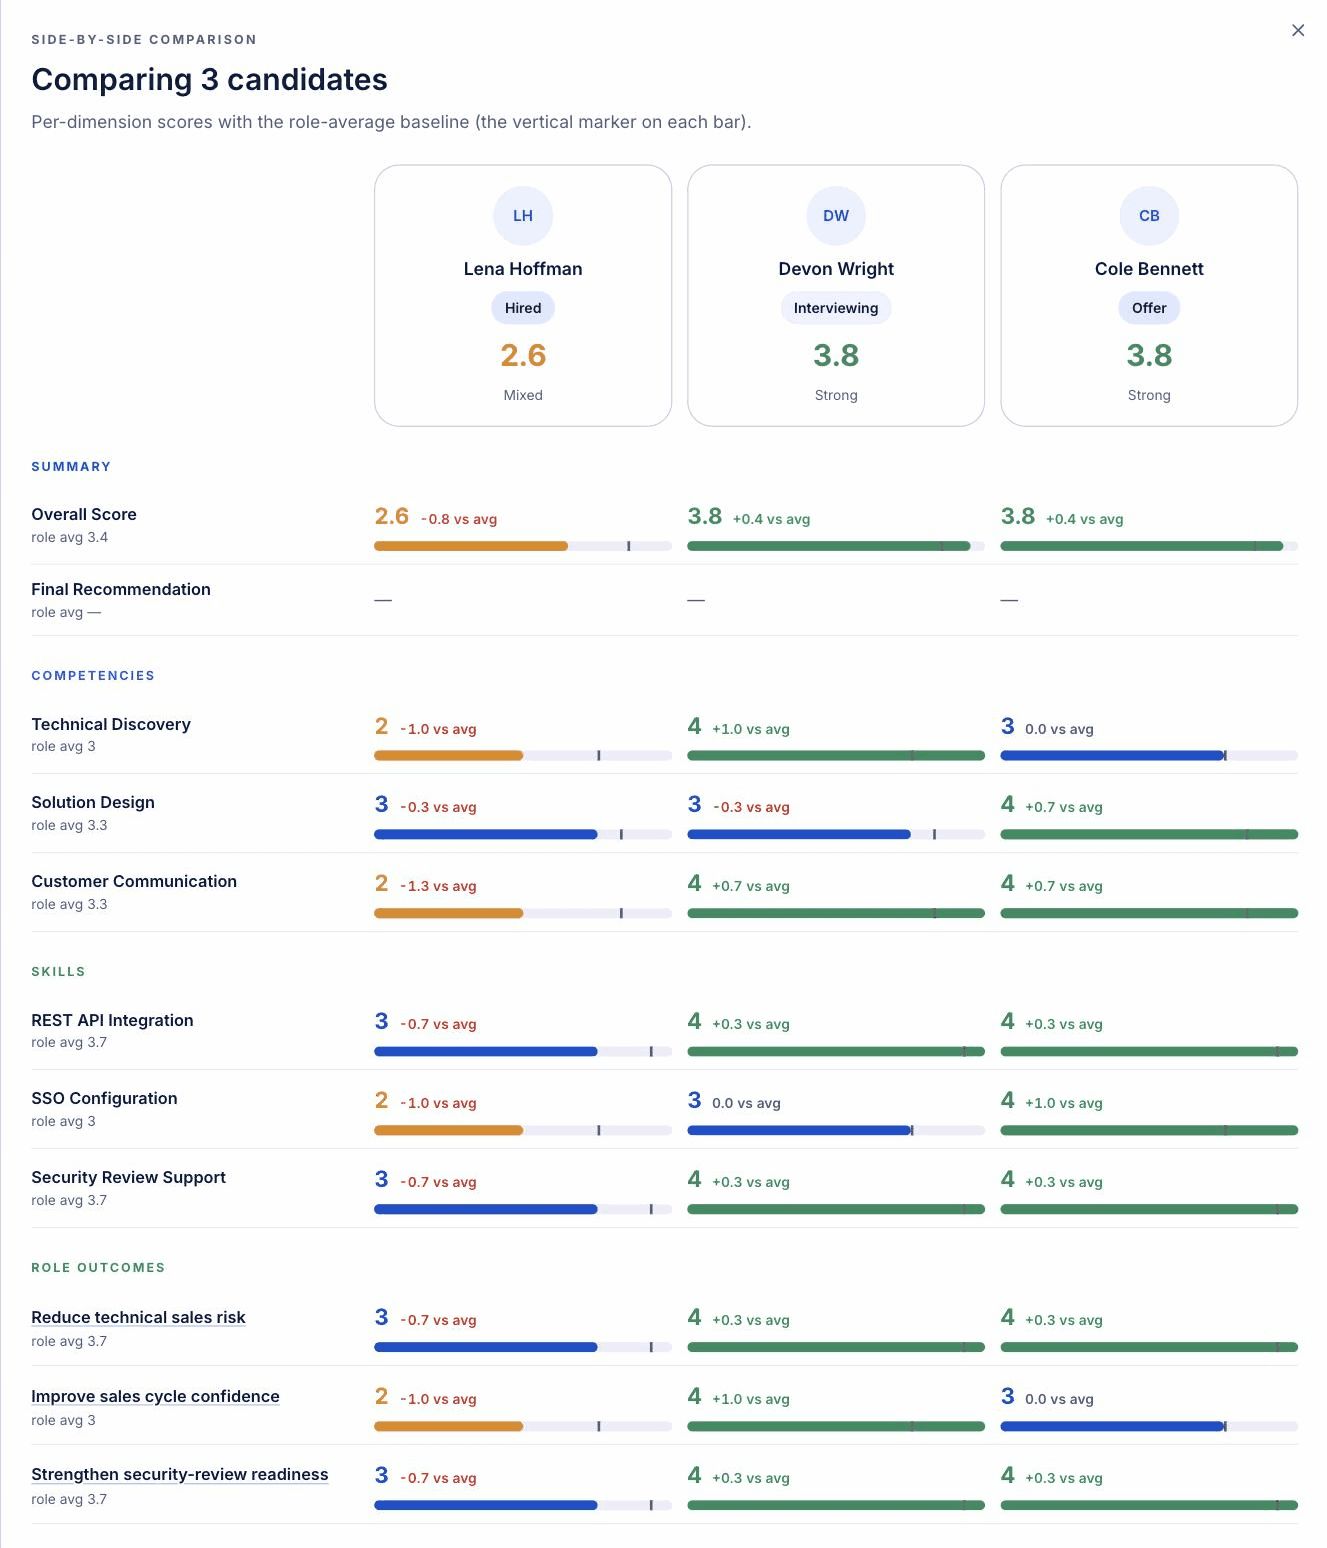
When it's down to the finalists, select up to four and open the side-by-side panel. Each candidate gets a card with their overall score and band, then every competency, skill, and outcome lines up as a bar — with the role-average marker and a plus-or-minus-versus-average figure on each one.
The trade-offs you'd argue about in a debrief are just there: one candidate is +0.7 on execution, another is stronger on collaboration. You're comparing evidence, not advocacy.
What is a candidate evaluation matrix?
A candidate evaluation matrix is a grid that scores each candidate against the same set of predefined criteria, so strengths and gaps can be compared on the same basis rather than by overall impression. The rows are usually the competencies or skills the role needs; the cells are each candidate's score on each one.
Built by hand, it's a spreadsheet someone maintains and no one quite trusts. In Yardstick the matrix is generated from the scorecards interviewers already filled in — it updates as interviews happen, stays tied to the role's defined criteria, and never depends on someone remembering to copy a score across. It's a structured interview turned into something you can actually decide from.
How to compare candidates fairly after interviews.
Compare candidates on the same basis: score everyone against the same role criteria, use the evidence each interviewer recorded rather than the room's gut feel, and read each score against a shared baseline so “good” means the same thing for every candidate. Structured interviews and scorecards make that possible; the comparison grid makes it quick.
This is also where the humans-and-agents model earns its keep. An agent can summarize the evidence and assemble the comparison for you through the yardstick CLI, but advancing, rejecting, and the final recommendation stay with the hiring team — the grid is the human's decision surface, not an automated verdict.
Comparing candidates, answered.
How do you compare candidates fairly after interviews?
Score every candidate against the same role criteria on a scorecard, then compare those scores side by side against a shared role-average baseline — so you're judging recorded evidence, not impressions. Structured interviews put every score on the same criteria; a comparison grid makes the comparison fast.
What is a candidate evaluation matrix?
A candidate evaluation matrix is a grid that scores each candidate against the same predefined competencies, so you can compare strengths and gaps on the same basis instead of by overall impression. Yardstick builds one automatically from your interview scorecards.
What's the best way to compare two final candidates?
Put both in a side-by-side view across each competency and look at the per-dimension gap to the role average, not just the overall score — two people can tie overall and be very different underneath.
How do you score candidates on a scorecard?
Each interviewer rates the candidate per competency — in Yardstick, on a 0–4.0 scale — and those ratings roll up into the comparison grid for the role.
What does "compare candidates side by side" mean in an ATS?
It means viewing several candidates' scores for the same role in one aligned grid or panel, instead of opening profiles one at a time and trying to hold the differences in your head.
Can you compare candidates across different interviewers?
Yes — every interviewer scores against the same structured scorecard for the role, so their ratings sit on the same defined criteria and scale and line up in one grid. Structure makes the comparison consistent; the hiring team still reads the evidence and decides.
See the candidate comparison grid in your pipeline.
Run structured interviews in Yardstick and the comparison grid builds itself — no spreadsheet, no seat per interviewer, pay only for active hiring.